


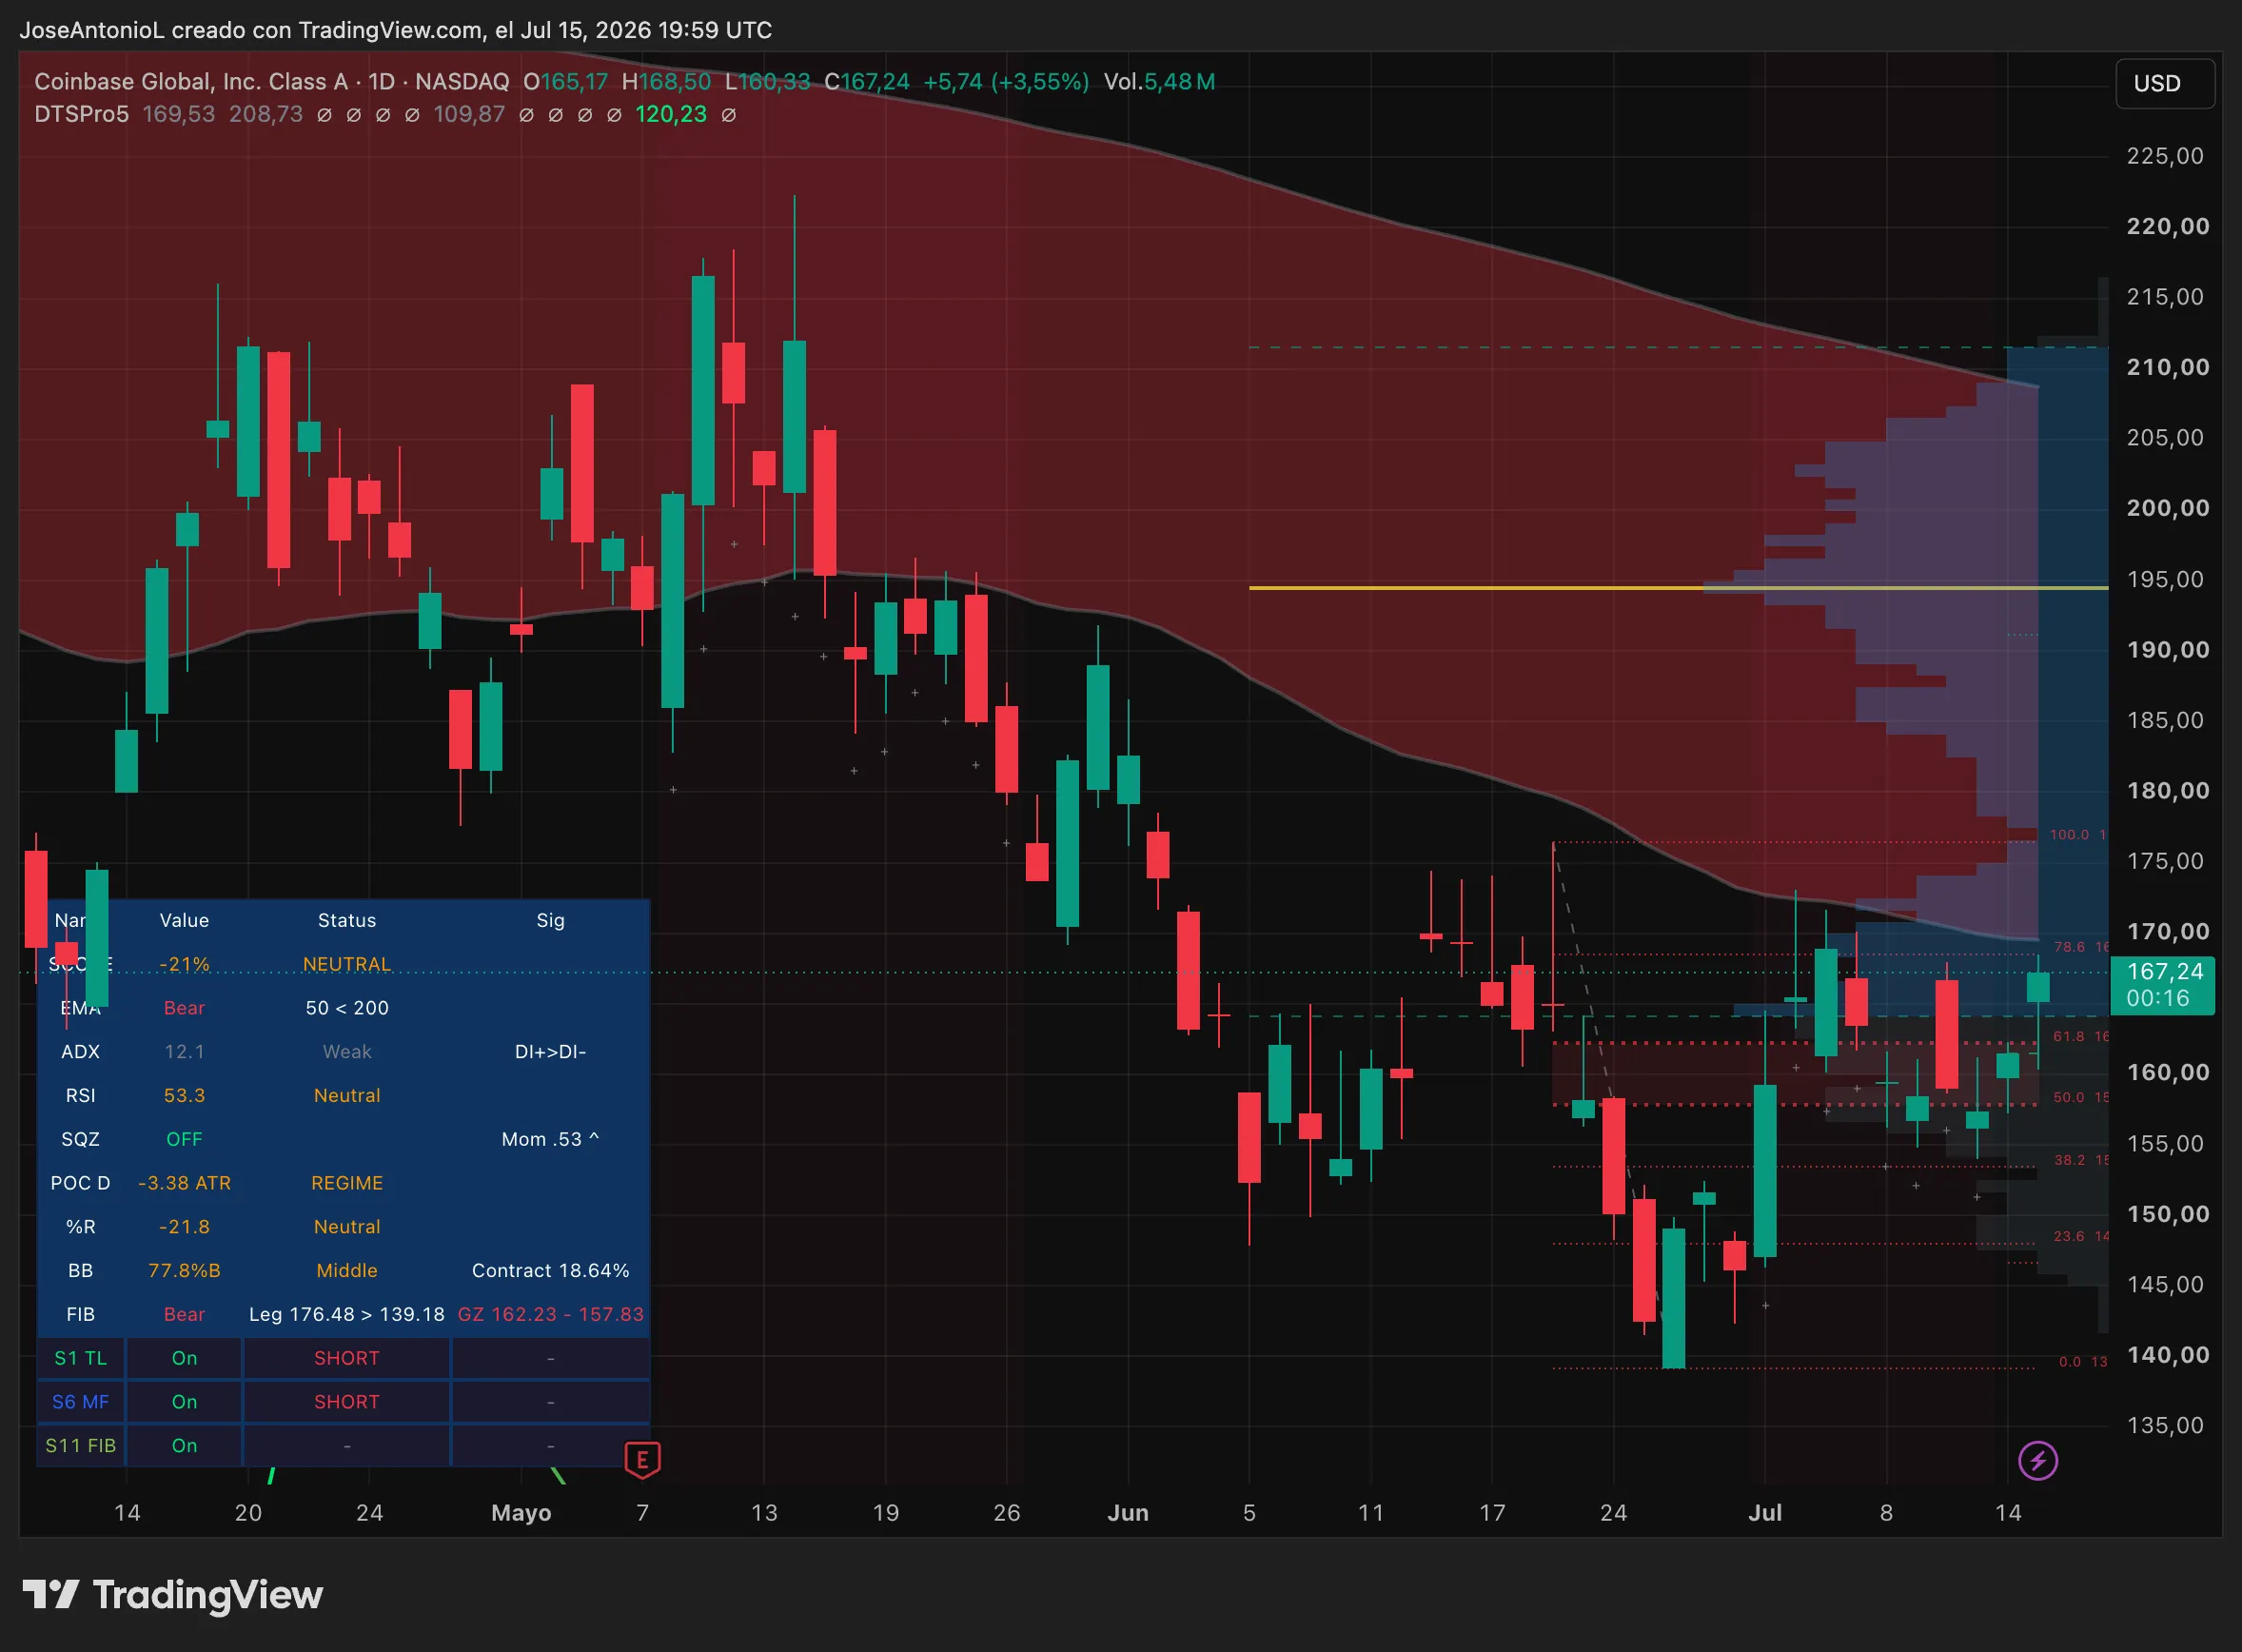
In a market exhibiting counterintuitive movements, both Coinbase (COIN) and Circle (CRCL) experienced notable stock price increases of approximately 3-4% on Wednesday. This rise occurred despite a significant downward revision of revenue and earnings forecasts for Coinbase by William Blair, a venerable Chicago-based investment bank with a long-standing reputation in technology and growth sector analysis. While slashing its financial projections, the firm maintained its "outperform" rating on Coinbase, signaling a belief that current market valuations already reflect the anticipated headwinds.
William Blair’s latest analysis, disseminated through an analyst note, projected a 12% reduction in Coinbase’s 2026 revenue estimates and a 13% decrease for 2027. More substantially, adjusted EBITDA (Earnings Before Interest, Taxes, Depreciation, and Amortization) projections were cut by a significant 34% for both years. Analysts Andrew Jeffrey and Adib Choudhury of William Blair indicated that they expect earnings to reach their lowest point in the latter half of 2026, with a projected recovery in 2027. Their rationale suggests that investors should remain invested, anticipating a bottoming out of spot cryptocurrency trading volumes that would coincide with a stabilization in Bitcoin’s price.
The firm’s outlook for Coinbase’s trading volume anticipates a considerable contraction in the current year. William Blair forecasts a roughly 44% decline in total trading volume for Coinbase in 2026, bringing the total down to an estimated $669 billion. However, this is expected to be followed by a robust rebound of over 32% in 2027. This projected recovery is underpinned by several factors that William Blair identifies as distinguishing the current market cycle from the downturn experienced in 2022. Chief among these is the advent of spot Bitcoin Exchange-Traded Funds (ETFs), which have democratized access to the cryptocurrency market for a broader range of investors. Furthermore, institutional participation has demonstrably grown, and the regulatory landscape surrounding digital assets has evolved significantly, providing a more structured and potentially more stable environment than in previous cycles.
William Blair also placed a strong emphasis on Coinbase’s burgeoning Base layer-2 network as a potential catalyst for future earnings growth. Beyond spot trading, the firm highlighted the increasing revenue contributions from retail derivatives and prediction markets. Notably, retail derivatives alone generated an annualized revenue exceeding $200 million in the first quarter, underscoring the diversification of Coinbase’s business model.
However, not all market observers shared William Blair’s optimistic near-term perspective. Piper Sandler analyst Patrick Moley adjusted his price target for Coinbase downwards to $155 from $170, while retaining a "neutral" rating. Moley identified prediction markets and perpetual futures as key performance drivers in the second quarter, with the FIFA World Cup, in particular, fueling a substantial surge in prediction market activity. He cautioned that the third quarter could see "significant investor attention on the perpetual future threat," indicating potential regulatory scrutiny or market shifts in this domain.

The performance of Coinbase and Circle shares has mirrored the broader cryptocurrency market’s recent trajectory. Coinbase has seen a decline of nearly 30% year-to-date, a trend that has largely paralleled Bitcoin’s approximately 26% depreciation over the same period. Circle, which made its public debut in a high-profile IPO on the New York Stock Exchange in June 2025 at $31 per share, has experienced a drop of about 20% since the beginning of the year. This collective underperformance underscores the sensitivity of these companies to the volatile nature of the digital asset market.
The "W" Pattern: Emerging Technical Indicators Suggest a Potential Bitcoin Reversal
Concurrently, a more optimistic outlook is emerging from the realm of technical analysis, particularly concerning Bitcoin. John Bollinger, a seasoned technical analyst renowned for his creation of Bollinger Bands, a widely used volatility indicator, has been closely observing a developing pattern on Bitcoin’s daily chart since early July. Bollinger Bands, which consist of bands plotted two standard deviations above and below a simple moving average, are employed by traders to identify periods of compression and potential breakouts.
On July 2nd, Bollinger shared his analysis on the social media platform X (formerly Twitter), pointing to a developing "W" or double-bottom formation on Bitcoin’s price chart. A double-bottom is a classic bullish reversal pattern characterized by two distinct troughs at similar price levels, separated by a moderate upward price movement. The pattern is typically considered confirmed once the price breaks decisively above the resistance level formed at the peak between these two lows.
Bollinger described the pattern as "perfectly fractal," meaning that smaller iterations of the same "W" shape are observable within the larger structure, and even on higher timeframes, such as the weekly chart. He acknowledged the inherent uncertainty in technical analysis, noting that previous bullish setups had been invalidated by persistent selling pressure throughout the current market cycle.
In a subsequent post on July 6th, Bollinger elaborated on the significance of this pattern, stating that its successful completion would serve as "a confirmation of a change in trend." This statement represents one of his clearest public indications to date that the prevailing bearish trend might be evolving into a bullish one, rather than merely experiencing a temporary pause. Bollinger also disclosed a long Bitcoin position held by his investment vehicle earlier this year, aligning his personal investment strategy with his public technical analysis. While Bitcoin’s price technically remains in bearish territory according to some indicators, Bollinger’s analysis suggests that this trend is losing momentum.
On-Chain Data and Macro Factors Signal Potential Bitcoin Bottom
Beyond technical indicators, on-chain data and macroeconomic trends are also contributing to the narrative of a potential Bitcoin bottom. Glassnode’s latest weekly analysis, published in Week 28 of 2026, highlights a significant development in long-term holder behavior. Long-term holders, who have been a primary source of selling pressure throughout the year, appear to have capitulated approximately two weeks prior to the report. The metric tracking the daily surrender of assets by long-term holders, adjusted to exclude internal transfers, reached a cycle peak and has subsequently begun to decline for the first time in the current cycle.
This capitulation was preceded by a wave of accumulation. Glassnode data indicates that buyers re-entered the market at the June lows, with a broad increase in acquisition observed across wallets of all sizes. Furthermore, Bitcoin’s relationship with the broader macroeconomic environment appears to be strengthening. Its inverse correlation with the U.S. dollar has deepened, while its correlation with U.S. equities has loosened. This suggests a return to Bitcoin’s role as a potential hedge against inflation and a store of value, as evidenced by its more pronounced reaction to positive macroeconomic news, such as a soft inflation print on Tuesday, which moved Bitcoin more significantly than major equity indices.
Despite these encouraging signs, a critical hurdle remains: the absence of sustained, spot-driven buying activity to definitively confirm the recovery. While derivative positions are unwinding, the supply of long-term sellers is diminishing, and the "fear premium" in the options market is easing, the influx of new capital has not yet reached a critical mass.
William Blair’s projections offer a timeframe for this potential capital inflow, placing the inflection point at 2027. Their forecast of a 32% rebound in Coinbase trading volume, following an anticipated 44% decline in 2026, suggests a belief in a significant market recovery driven by renewed investor confidence and increased participation. This anticipated resurgence in trading activity would be a crucial indicator of broader market health and a testament to the evolving dynamics of the digital asset ecosystem.
The interplay between analyst sentiment, technical chart patterns, on-chain data, and macroeconomic factors paints a complex but increasingly constructive picture for the cryptocurrency market. While challenges persist, the convergence of these signals suggests that the current period of downturn may be laying the groundwork for a substantial recovery in the coming years.
