


The cryptocurrency market has officially turned the page on September, a month that defied traditional bearish expectations, and is now entering October—a period historically characterized in digital asset circles as "Uptober." Bitcoin, the world’s leading digital asset, begins the month trading at approximately $83,823, marking a modest 0.28% increase over the last 24 hours. While the month of September was initially on track to set a new record for historical returns, a late-month market correction tempered those gains. Ultimately, Bitcoin closed September with a 6.33% increase, narrowly missing the 2024 record of 7.29% but successfully avoiding the "Red September" curse that has plagued the industry in previous years.
The Legacy of Red September and the Rise of Uptober
To understand the current market position, one must look at the seasonal patterns that have defined Bitcoin’s performance over the last decade. Historically, September has been the most challenging month for crypto investors, often associated with risk-off sentiment and profit-taking. However, the data from 2026 suggests a departure from this trend. With a 6.33% gain, September proved that even in the face of restrictive monetary policies, the asset class maintains a degree of resilience.
October, conversely, has built a reputation for bullish activity. According to data aggregated by CoinGlass, October has delivered an average return of 19.92% and a median return of 14.71% since 2013. Analysts frequently attribute this phenomenon to institutional budget cycles, tax-loss harvesting preparations, and a general easing of late-summer liquidity constraints. However, market participants are cognizant that past performance is not indicative of future results; notably, October 2025 closed down 3.69%, serving as a stark reminder that cyclical patterns can be disrupted by exogenous macro events.

Macroeconomic Environment and Federal Reserve Policy
The primary narrative surrounding Bitcoin’s price discovery remains its sensitivity to the broader macroeconomic climate. On September 16, the Federal Reserve signaled a shift in its monetary stance, implementing a 25-basis-point interest rate hike that pushed the federal funds rate to a range of 3.75% to 4%. This decision, the first rate increase since July 2023, was reached via a unanimous vote, signaling a firm commitment by the Federal Open Market Committee (FOMC) to combat lingering inflationary pressures.
The implication for non-yielding assets like Bitcoin is significant. When interest rates rise, the opportunity cost of holding assets that do not provide a yield increases. Investors are increasingly drawn to the "risk-free" return offered by U.S. Treasury bonds, which have reached 52-week highs. As of the end of September, the 10-year Treasury yield climbed to 5.289%, while the 30-year yield hit 5.632%.
Federal Reserve Chair Kevin Warsh has maintained a hawkish tone, emphasizing that inflation remains elevated above the central bank’s target. The median projection from the Fed indicates the potential for an additional 25-basis-point hike before the end of the year, with the next critical meeting scheduled for October 28. Market participants are now bracing for the volatility that typically precedes and follows these announcements.
Institutional Flows and ETF Performance
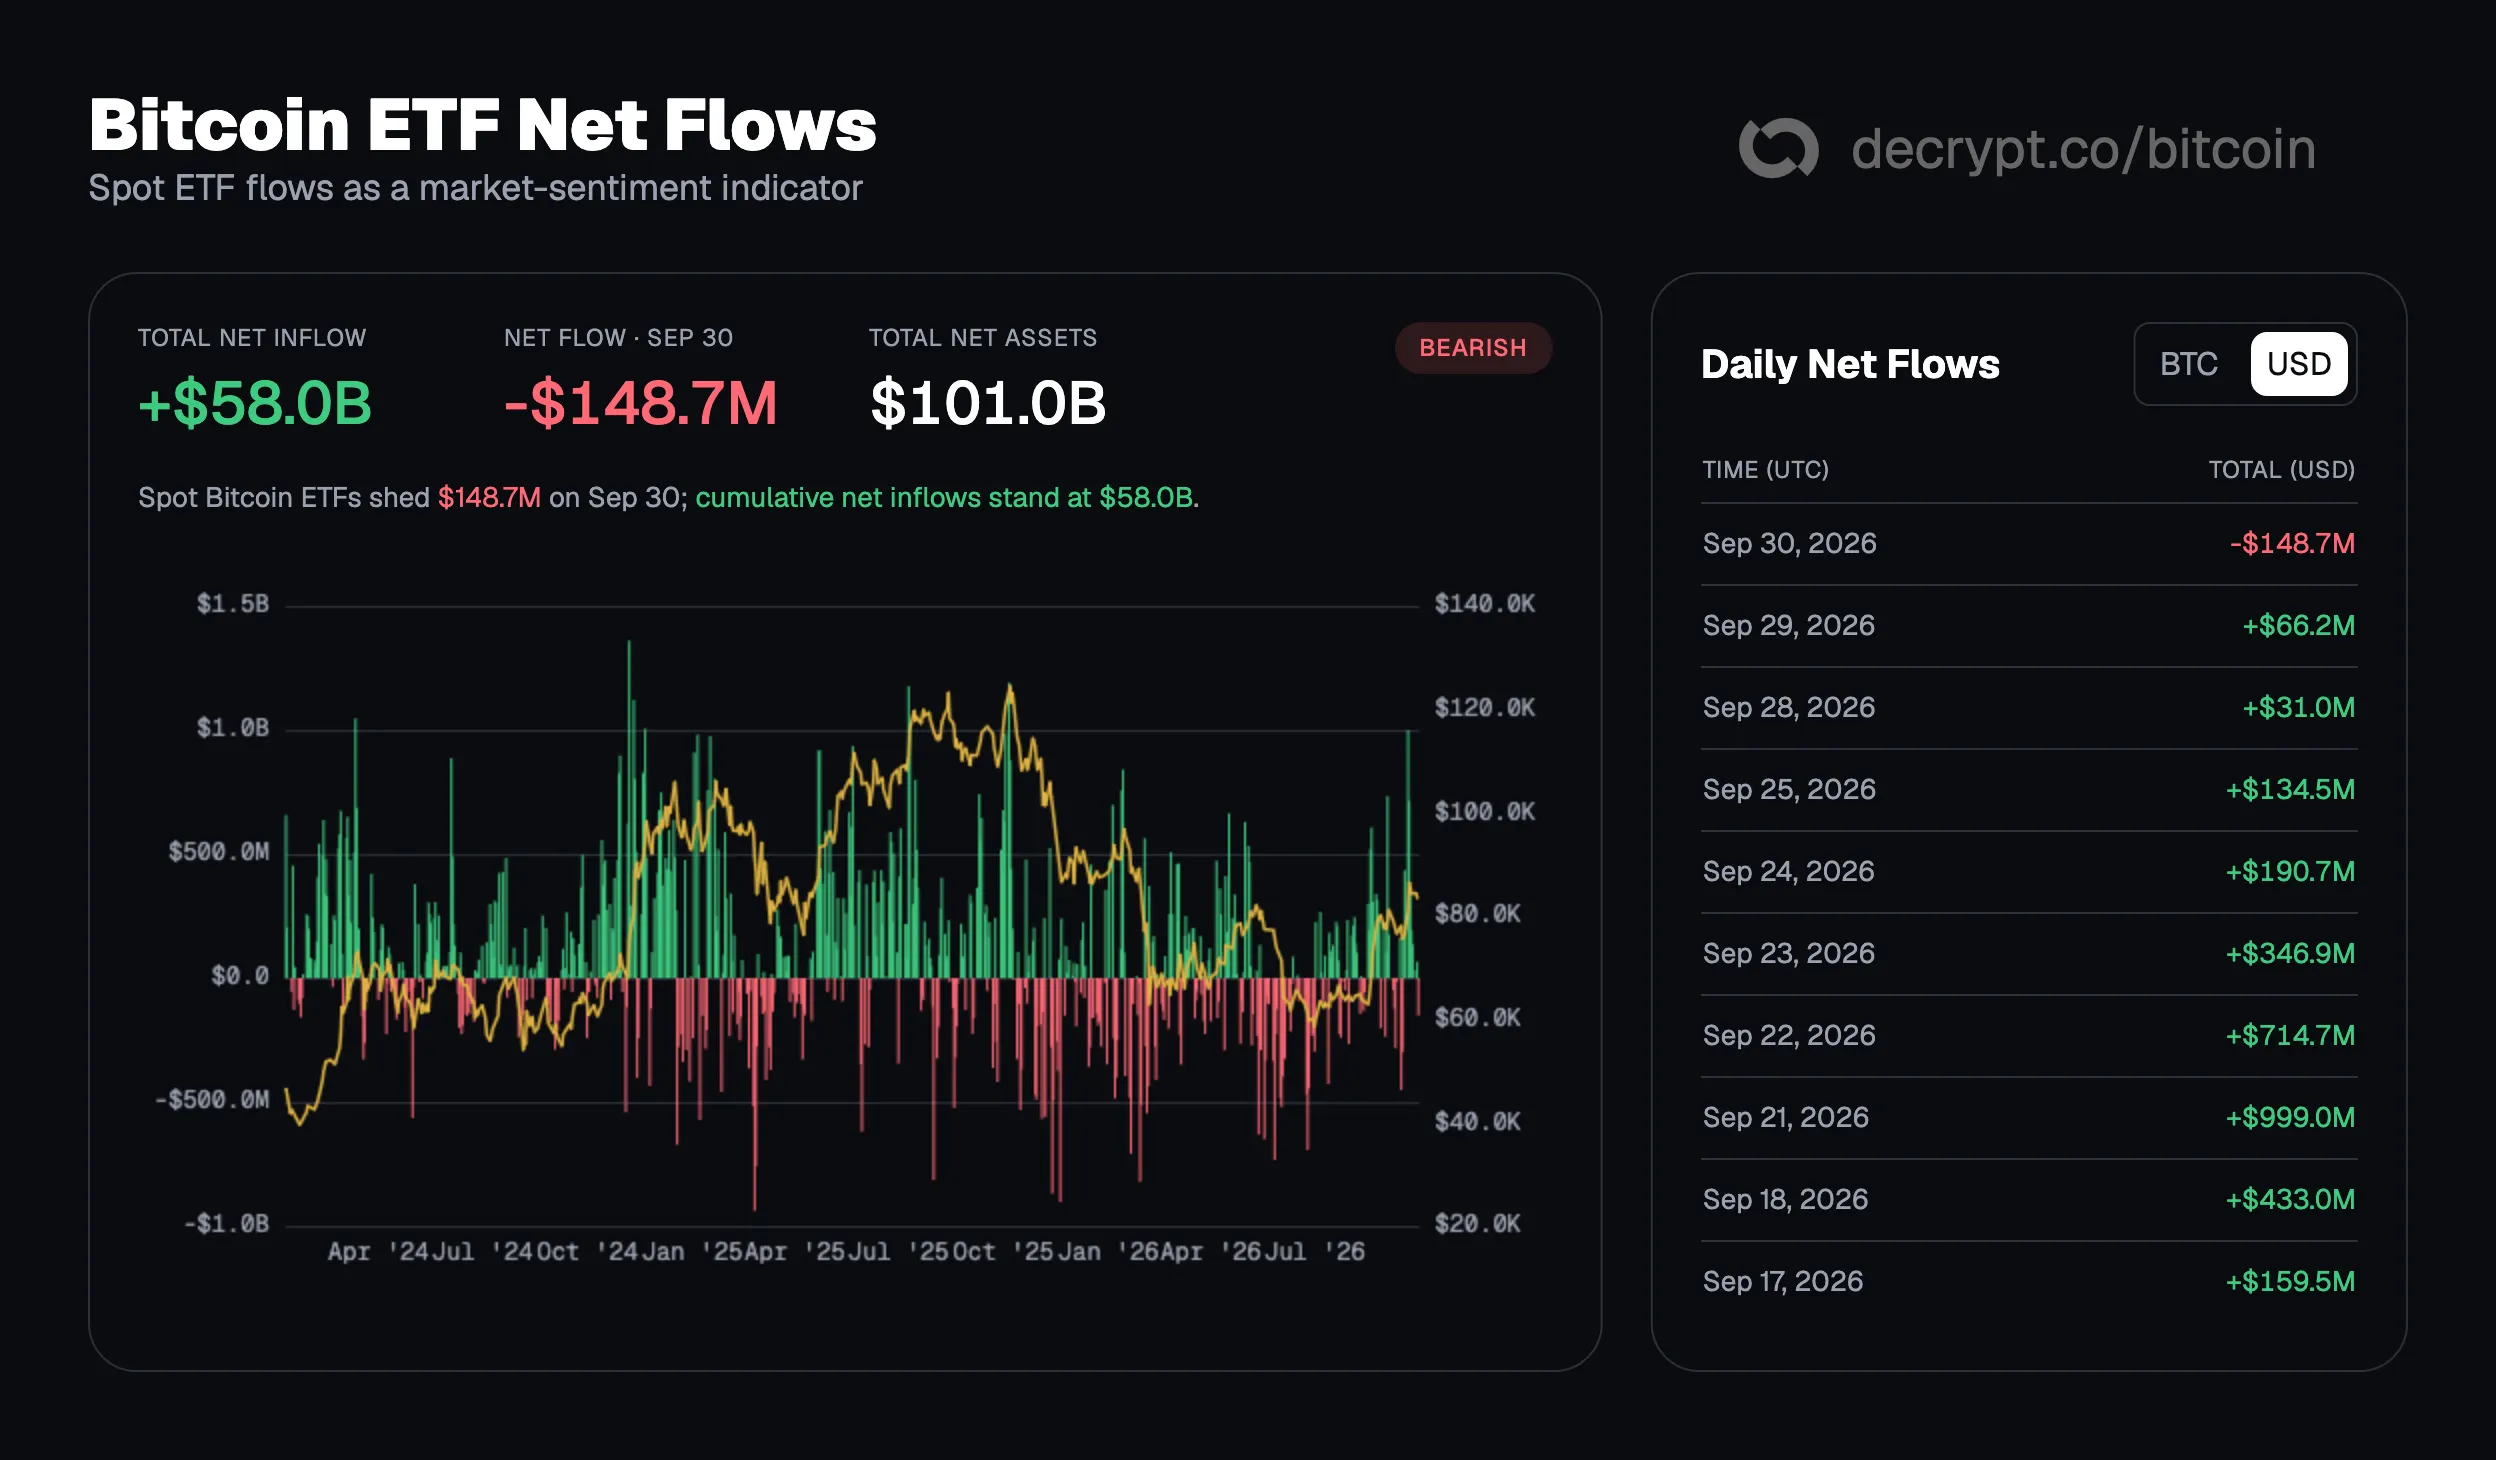
The institutional adoption of Bitcoin, largely funneled through spot Exchange Traded Funds (ETFs), has provided a steady bedrock for price stability. Through September 29, the Bitcoin ETF sector experienced a robust nine-day inflow streak, accumulating approximately $3.08 billion in net assets. This surge underscores the institutional appetite for Bitcoin as a portfolio diversification tool, even amidst a rising rate environment.
However, the momentum faced a slight reversal on September 30, which saw net outflows of $148.69 million. While this is a marginal drop against a total net asset base exceeding $101 billion, it highlights the sensitivity of institutional flows to short-term price fluctuations. Looking back at the week of September 21, the market witnessed an influx of roughly $2.4 billion, including a standout day of $999 million in net buying. The current week has started with net outflows of $51.42 million, suggesting a period of consolidation as investors digest the implications of the latest Fed policy shift.
Predictive Markets and Sentiment Analysis
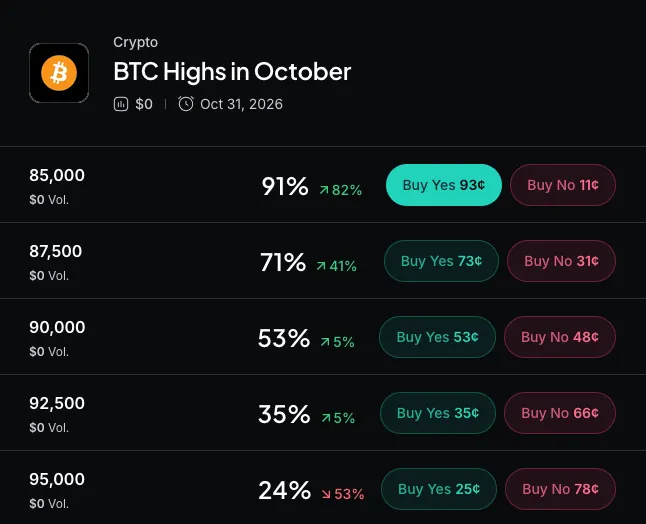
As the market enters the final quarter of the year, sentiment is being quantified through decentralized prediction markets. On platforms like Myriad, traders are currently assigning a 90% probability to Bitcoin hitting a high of $85,000, viewing this as a near-certainty. Furthermore, there is a 70% probability assigned to the asset reaching $87,500.
Conversely, long-term optimism regarding a new all-time high remains muted in the immediate term. Traders currently give only a 7% probability that Bitcoin will eclipse its previous all-time high before the end of 2026. This reflects a cautious outlook, with many market participants anticipating that the asset will continue to trade within a established range rather than embarking on a parabolic breakout.
Technical Analysis: Strength Without Overextension
From a technical perspective, Bitcoin’s price action demonstrates a strong underlying trend that is currently undergoing a healthy, expected consolidation. The daily candlestick opened at $83,588.27, trading within a range between $83,134.08 and $84,360.88. The recent pullback from the $87,354.33 swing high—which followed a robust bounce off the $74,977.57 support level—suggests that the market is currently searching for a new floor.
Key technical indicators provide a clearer picture of this trend:
- Average Directional Index (ADX): At a reading of 41.5, the ADX indicates a strong, well-defined trend. Since this value is significantly above the 25 threshold, it confirms that the market is not moving sideways but is instead under the influence of a directional force, with the positive directional line dominating.
- Exponential Moving Averages (EMA): The 50-day EMA currently sits above the 200-day EMA. This configuration is widely recognized as a "golden cross" pattern, signaling that the short-term trend is decisively bullish.
- Relative Strength Index (RSI): The RSI is currently at 61.8. This indicates that buying momentum is strong, but the asset is not yet in "overbought" territory (typically defined as an RSI above 70). This suggests there is still room for further appreciation before the market becomes prone to significant profit-taking.
- Volatility Indicators: The Squeeze Momentum Indicator is currently "off," suggesting that the period of volatility compression has concluded and the market is now in a phase of expansion. Bollinger Bands are currently widening, which often precedes increased price movement and confirms that the recent consolidation is part of a larger, active trend.
Upcoming Catalysts and The Road Ahead
The trajectory of Bitcoin throughout October will be dictated by a series of high-impact economic releases. Market analysts are closely watching the following dates:
- October 2: The release of the September jobs report, which will offer the first comprehensive look at labor market health following the Fed’s September rate hike.
- October 7: The release of the FOMC meeting minutes, which will provide deeper insight into the internal debates among Fed officials regarding the pace of future rate adjustments.
- October 14: The release of the Consumer Price Index (CPI) data, which remains the primary gauge for inflationary pressure.
- October 28: The next Federal Reserve interest rate decision, which will be the final major macroeconomic hurdle for the month.
The confluence of these events, combined with the historical tendency for October to provide positive returns, creates a complex landscape. While the macro environment—characterized by rising yields and restrictive monetary policy—presents a challenge, the technical indicators and institutional participation levels suggest that Bitcoin remains in a position of structural strength. Whether "Uptober" can overcome the current headwinds of the tightening cycle remains the central question for the remainder of the quarter. Market participants are advised to monitor the interaction between bond market yields and digital asset inflows as the primary indicator of market direction in the weeks ahead.
