

The Shift from Deterministic to Probabilistic Monitoring
The transition from deterministic software to agentic workflows represents a fundamental change in how developers define system health. In a traditional monolithic or microservices architecture, inputs are mapped to predictable outputs. If a service experiences an issue, stack traces and exception logs typically provide a clear path to the root cause. However, AI agents operate in a probabilistic space where the same prompt can result in vastly different execution paths depending on external variables like model temperature, retrieval-augmented generation (RAG) context, and available tool sets.
By 2026, industry standards have shifted to accommodate these unique challenges. As noted in recent observability research, the primary failure modes for agents are no longer just service outages, but rather "logic drifts"—where the agent’s reasoning chain deviates from intended parameters. A health check reporting that an agent is "up" provides virtually no insight into whether the agent actually performed the task correctly or efficiently. Consequently, observability has been redefined as the practice of capturing every model call, tool execution, and intermediate reasoning step as structured data, enabling engineers to reconstruct the agent’s "thought process" post-mortem.
Anatomy of an Agentic Failure
Consider the scenario of an automated customer support agent tasked with processing refund requests. The agent is designed to query a database tool and provide a resolution. In an unobserved environment, the agent might call the refund-lookup tool twice with slightly conflicting parameters, ignore the first valid result, and provide an erroneous response based on the second. Because the API call to the database succeeded and the LLM returned a response, the system logs this as a successful transaction. The failure remains hidden until the customer reports the error days later.
This highlights why traditional monitoring—which focuses on requests-per-second and latency—fails to account for agentic nuances. In the AI era, cost and performance metrics must shift toward token consumption and reasoning latency. A single, slow request might not just be a bottleneck; it could represent a runaway token loop or a prompt injection attempt that is consuming thousands of tokens without triggering any conventional alert.
Pillars of Agentic Observability
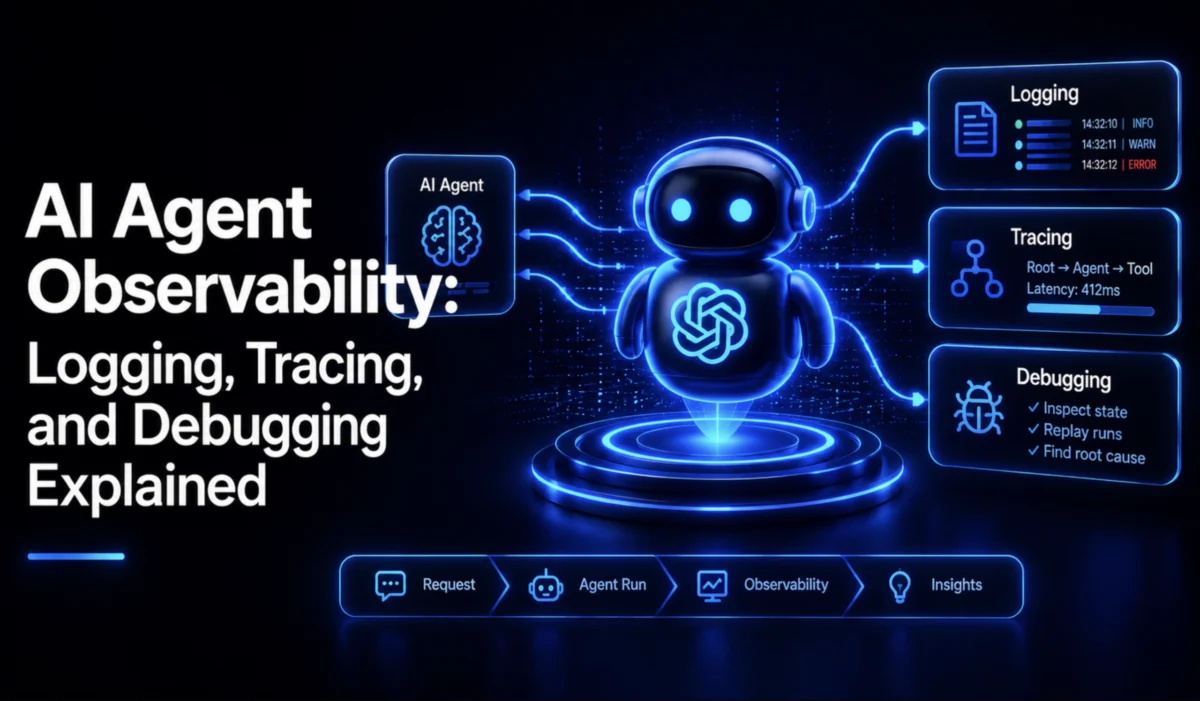
To bridge this visibility gap, development teams are adopting a three-tiered approach: structured logging, distributed tracing, and specialized metric tracking.
1. Structured Logging and Contextual Metadata
Standard logging is insufficient for agents. To be useful, every log entry must be tagged with a persistent trace ID. This allows an engineer to filter logs to a specific user session, isolating the exact sequence of events that led to a faulty output. Furthermore, logging should focus on metadata—such as tool names, argument structures, and result lengths—rather than raw content. This preserves debugging utility while minimizing the risk of logging sensitive personal information (PII) present in prompt or completion text.
2. Distributed Tracing: Mapping the Reasoning Chain
Tracing is the backbone of agentic observability. It transforms a series of discrete events into a coherent waterfall chart, illustrating the parent-child relationships between model inference, tool execution, and sub-workflow triggers. By leveraging the OpenTelemetry GenAI semantic conventions, developers can standardize how these traces are generated.
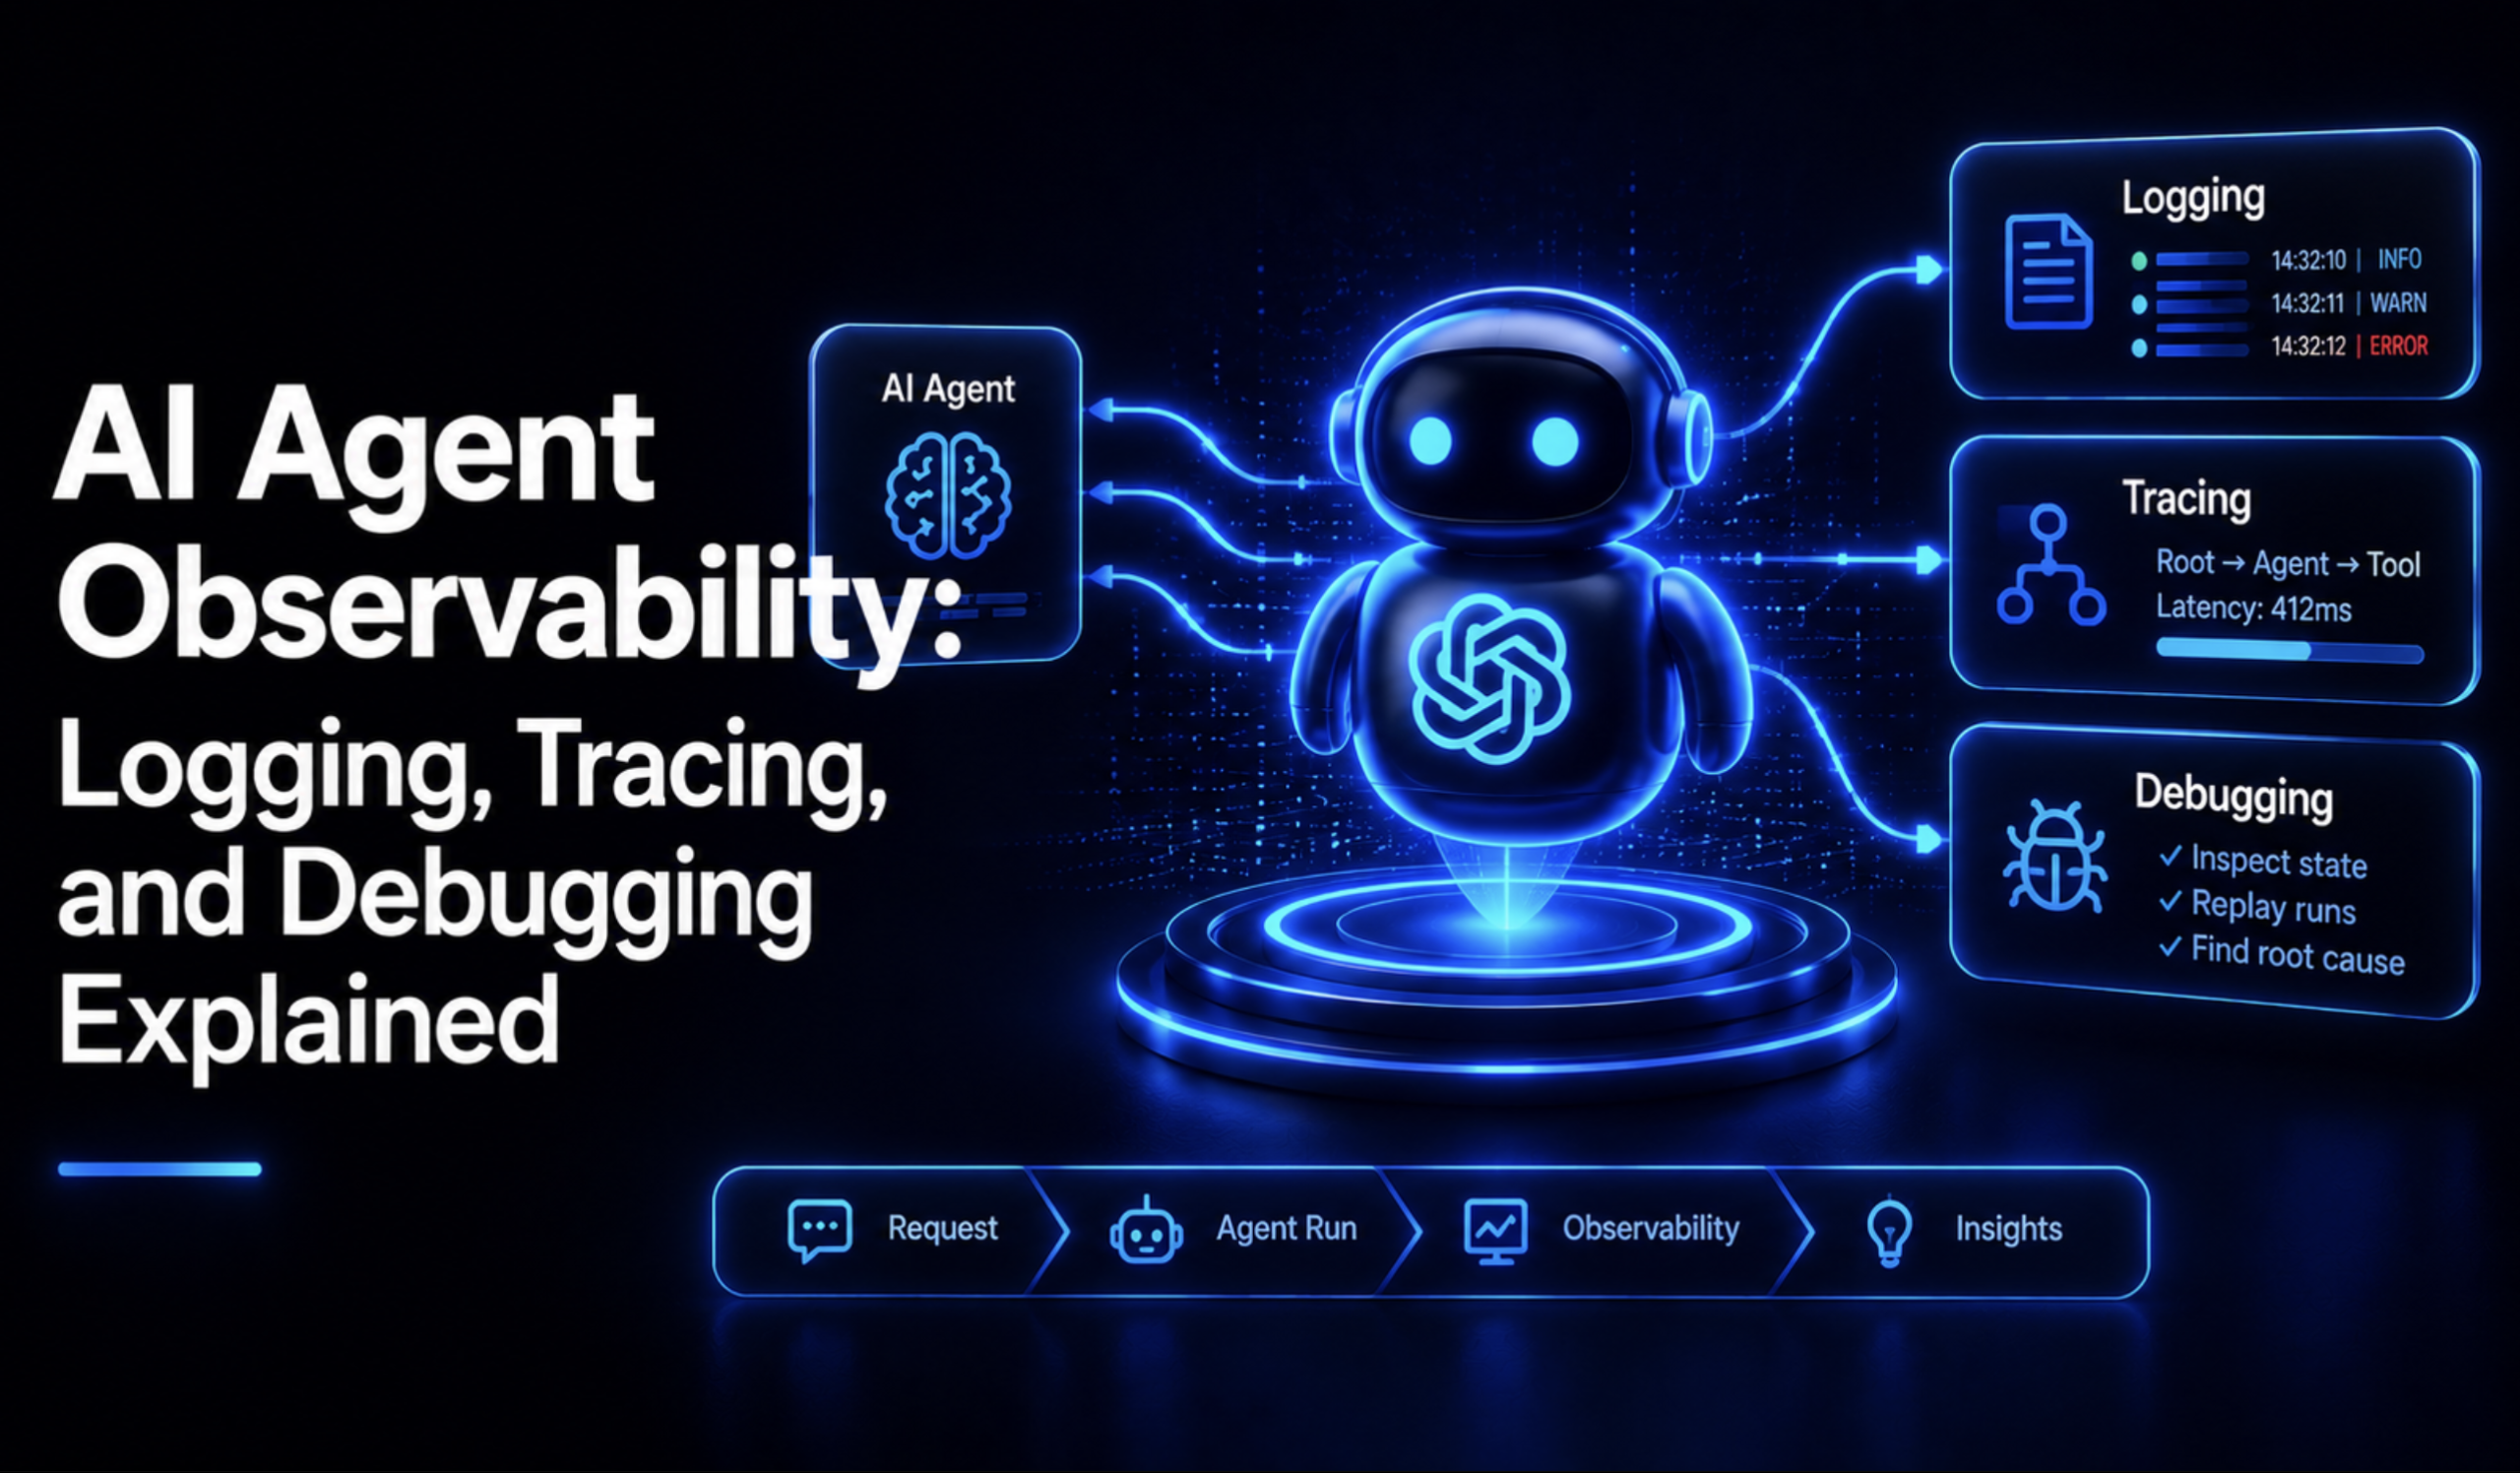
The standard defines key spans such as invoke_agent for the top-level request, chat for the model inference, and execute_tool for external operations. This structure allows developers to visualize "where" time and tokens are spent. For example, if a trace shows two execute_tool calls occurring sequentially for the same lookup, the inefficiency is immediately apparent in the waterfall view, providing a diagnostic clarity that logs alone cannot offer.
3. Token Tracking and Cost Metrics
Financial predictability is a major concern for enterprise AI adoption. Metrics like gen_ai.client.token.usage and gen_ai.client.operation.duration must be monitored with high granularity. Rather than tracking a single aggregate token count, high-performing teams separate input and output tokens. This distinction is vital; a sudden spike in input tokens often indicates that the system prompt or context window has become bloated, potentially degrading model performance and increasing costs without providing added value.
Industry Standards and Tooling Evolution
The integration of Model Context Protocol (MCP) in 2026 has further streamlined observability. New semantic conventions for MCP allow tools to pass protocol-level metadata—such as session IDs and method names—into existing trace spans. This enrichment ensures that when an agent calls out to multiple MCP servers, the resulting trace remains readable and does not devolve into a chaotic list of disconnected events.
The tooling landscape has matured significantly to support these practices. Organizations currently choose between three primary deployment models:
- Self-Hosted Platforms: Tools like Langfuse and Arize Phoenix are favored by organizations with strict data residency requirements. These platforms provide deep visibility while allowing teams to maintain full control over their infrastructure.
- Managed SDKs: Services like LangSmith and Braintrust are preferred for their speed of implementation. These solutions often bundle evaluation and testing tools with their observability suites, creating a "closed loop" where debugging data directly informs future prompt improvements.
- Proxy Gateways: Services like Helicone act as a routing layer, sitting between the application and the LLM provider. This allows for near-zero-code integration, capturing cost and performance data across hundreds of models, though it introduces a dependency on the gateway’s uptime.
Implications for Future Development
The widespread adoption of these observability practices has profound implications for AI safety and reliability. As agents are given more autonomy, the ability to perform "time-travel debugging"—the capacity to restore the state of an agent at a specific step in the reasoning chain—will become a baseline requirement for production-grade systems.
Furthermore, the shift toward natural-language trace querying represents the next frontier. Instead of manually inspecting waterfall charts, engineers can now use LLM-powered interfaces to query their own telemetry data, asking questions such as, "Why did the agent enter a loop in this specific session?" The system then synthesizes the trace data to provide a plain-English explanation.
Conclusion
The "black box" nature of AI agents is not an inherent limitation, but rather a reflection of the inadequacy of current monitoring tools. By treating logging, tracing, and metric collection as first-class citizens in the development lifecycle, engineers can transition from guessing why an agent failed to understanding the precise logical path taken during every execution. As the industry moves forward, the ability to monitor, analyze, and debug these systems will be the primary differentiator between successful AI-driven products and those that fail due to unpredictable, silent errors. Proactive observability is no longer an optional feature—it is the prerequisite for the reliable deployment of agentic AI.
