
Bitcoin experienced a significant surge today, driven by a geopolitical development that few analysts had anticipated: Iran’s announcement that the Strait of Hormuz, a critical global oil chokepoint, will remain fully open amidst ongoing ceasefire negotiations. This unexpected de-escalation sent ripples through global markets, causing oil prices to plummet and igniting a rally across risk assets, with Bitcoin leading the charge.
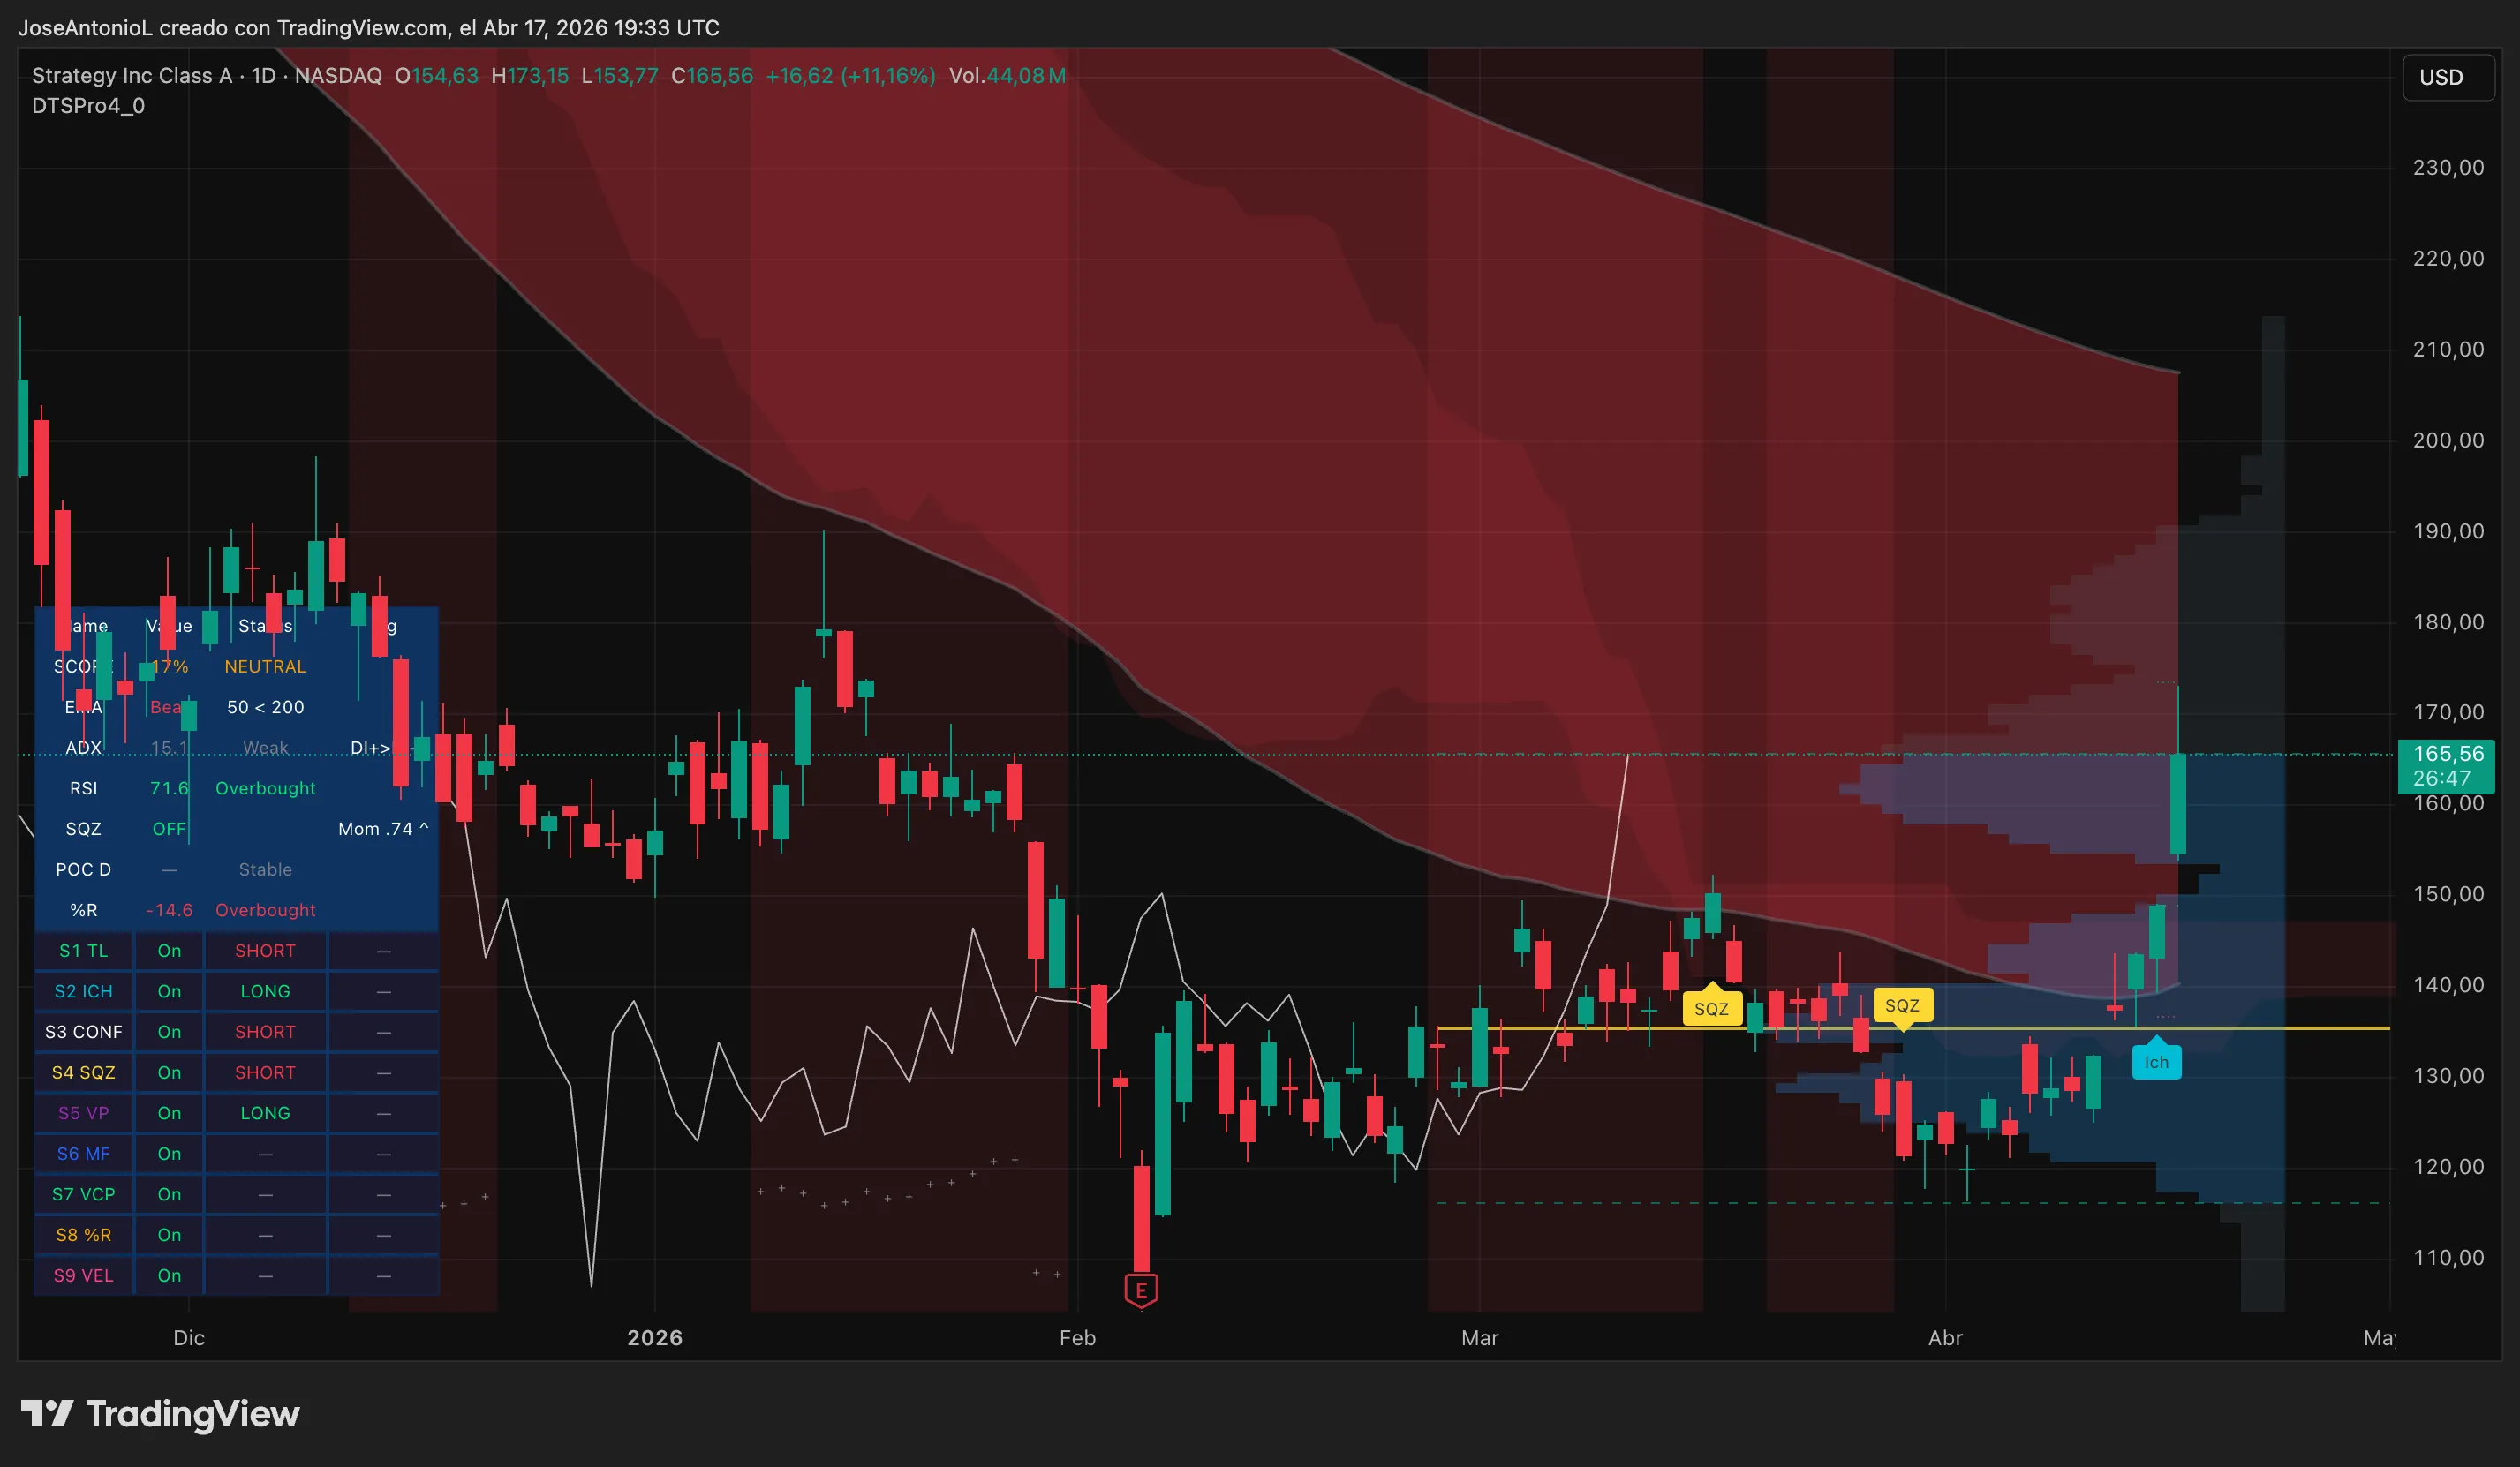
The cryptocurrency, often considered a barometer of market sentiment and a hedge against geopolitical uncertainty, climbed above the $78,000 mark intraday following the news. While it saw a slight pullback thereafter, the broader digital asset landscape benefited considerably. Notably, digital asset treasury stocks such as MicroStrategy (MSTR) saw gains exceeding 10%, as the ascent of Bitcoin bolstered the value of their holdings, pushing them back into positive territory after a period of decline.
This sharp upward movement marks a potential turning point for Bitcoin, which has been navigating a challenging macro environment throughout 2026. The digital asset had been under pressure since its peak of approximately $126,000 in October 2025, weighed down by escalating Middle Eastern tensions, persistent inflation fears, a strong U.S. dollar, and restrictive liquidity conditions. Bulls in the cryptocurrency market are now hoping this geopolitical détente signals a sustained shift in market dynamics.
Bitcoin Breaks Descending Trendline, But Caution Remains
The intraday trading action for Bitcoin today has been particularly significant. The cryptocurrency opened the trading session at $75,172 and saw strong buying pressure push the daily candle to $77,205, representing a 2.7% gain for the session. The intraday high reached an impressive $78,384, a level not seen for some time.
This upward momentum is crucial as it appears to have invalidated a descending resistance trendline that had been capping Bitcoin’s rallies since October 2025. For approximately seven months, this trendline acted as a persistent ceiling, rejecting every attempt by bulls to push prices higher. The fact that Bitcoin has traded above this critical line for the first time since the bearish pattern began is a key development for technical analysts.

Since its all-time high, Bitcoin had been tracing a well-defined descending channel on price charts, characterized by lower highs, lower lows, and a series of failed breakout attempts. Each rally attempt had been met with increasing selling pressure, and the structure indicated a steady compression where shallower bounces were followed by deeper dips towards support levels. Prior to today’s surge, technical analysis suggested that if this trend continued uninterrupted, Bitcoin could have been headed towards a support zone between $50,000 and $55,000. Today’s news appears to have significantly delayed, if not entirely averted, that bearish scenario.
Technical Indicators Signal Shifting Sentiment
Beyond the price action, several technical indicators are offering a more optimistic outlook for Bitcoin bulls, albeit with caveats.
The Exponential Moving Averages (EMAs), which provide insights into underlying trends by smoothing price data, still reflect a bearish structure. The 50-day EMA remains below the 200-day EMA, a configuration commonly referred to as a "death cross." This pattern is traditionally interpreted by traders as a structural bearish signal, indicating that the short-term trend has not yet recovered sufficiently to overcome the longer-term average. While a death cross does not guarantee further price declines, it signals that bulls face a considerable challenge in establishing a new, sustained uptrend. However, a notable development is that the gap between these two EMAs has begun to compress for the first time since January, suggesting a potential convergence of short-term and long-term price trends.
The Average Directional Index (ADX), a measure of trend strength, currently stands at 18.1. A reading below 25 generally indicates a lack of strong conviction in the market, allowing for price movement but without significant underlying momentum. Given that the market has been in a bearish phase for nearly half the year, a weak ADX suggests that the current trend may be losing steam, or that traders are strategically accumulating assets within this price range in anticipation of a reversal.
The Relative Strength Index (RSI), a momentum oscillator that measures the speed and magnitude of price changes, is at 67.7. While this indicates that Bitcoin is approaching overbought territory (traditionally considered above 70), it remains within a manageable range. The RSI at 67.7 suggests that while traders may begin to take profits, there is still room for price appreciation before significant technical selling pressure intensifies.
Furthermore, the Squeeze Momentum Indicator, which identifies periods of price compression preceding potential significant price movements, shows that positive momentum has been released, aligning with the recent bullish surge.
Market Expectations on Prediction Platforms
Insights from decentralized prediction markets offer a glimpse into the sentiment of active traders. On Myriad, a platform developed by Decrypt‘s parent company, Dastan, traders are currently favoring a bullish trajectory for Bitcoin’s next significant price move. The prevailing sentiment indicates a 69% probability that Bitcoin will reach $84,000 before experiencing a decline to $55,000. This margin in favor of a price pump represents the widest gap observed since the market’s inception in early February.
However, these same traders exhibit a more cautious outlook regarding the timeline for substantial gains. A separate Myriad market suggests that Bitcoin has only a 6% chance of achieving a new all-time high before July, indicating a belief that while an upward trend is likely, it may unfold over a longer period.
Future Outlook and Potential Scenarios
The path forward for Bitcoin will likely depend on its ability to maintain its position above the previously broken trendline, which is now expected to act as support in the $74,000-$75,000 range. A sustained climb in the ADX above 20-25 would further validate the strength of any emerging uptrend.
Conversely, if bearish sentiment reasserts itself, a rejection from current levels, coupled with a decline in the RSI from its near-overbought position, could send Bitcoin back to test the aforementioned support area. A breach below this zone would transform the broken resistance back into a significant resistance level, effectively invalidating the recent breakout and signaling a continuation of the bearish trend.
The geopolitical development concerning the Strait of Hormuz has undeniably injected a significant positive catalyst into the market, providing a much-needed reprieve for Bitcoin and risk assets. The coming days and weeks will be critical in determining whether this geopolitical détente translates into a sustainable macroeconomic shift and a sustained bull run for digital assets, or if the underlying bearish pressures will re-emerge. The market’s reaction to this unexpected easing of tensions will be closely watched by investors and analysts alike.
Disclaimer: The views and opinions expressed by the author are for informational purposes only and do not constitute financial, investment, or other advice.
