
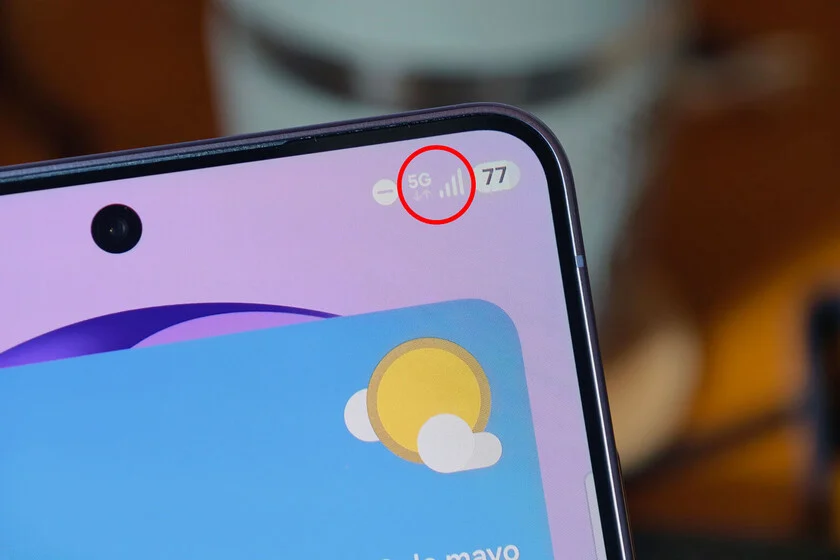
It is a common frustration in the modern digital age: gazing at a smartphone screen, observing the reassuring full complement of signal bars, and the prominent "5G" icon, only to find web pages load at a glacial pace, applications stutter, and videos buffer interminably. This paradox, where apparent robust connectivity fails to deliver actual high-speed internet, is a source of widespread bewilderment for countless users. The intuitive assumption that maximum signal strength equates to maximum internet speed is deeply ingrained, yet it represents a fundamental misunderstanding of how contemporary mobile networks, particularly 5G, operate. The simplistic visual indicator of signal bars, a vestige of earlier telecommunications eras, often paints a misleading picture, failing to convey the complex interplay of factors that truly dictate mobile internet quality and speed.
The Misleading Simplicity of Signal Bars: A Legacy Indicator
For decades, the visual representation of signal strength on mobile devices – a series of increasing bars or an ascending graphical icon – has served as the primary, and often sole, indicator of network connectivity. This system originated in the era of 2G Global System for Mobile Communications (GSM) networks, where the primary function of a mobile phone was voice calls and rudimentary text messaging (SMS). In that context, a strong signal, as denoted by more bars, directly correlated with the likelihood of successfully initiating or receiving a call and maintaining its quality. The metric primarily measured the Received Signal Strength Indicator (RSSI), a raw measurement of the total power present in the received radio signal, including both desired signal and noise.
However, the evolution from 2G to 3G, 4G, and now 5G has fundamentally transformed mobile networks from voice-centric systems to data-driven powerhouses. With each generational leap, the demands on network infrastructure have escalated exponentially, shifting the focus from mere signal presence to signal quality, capacity, and efficiency. The simple signal bars, while still visually intuitive, have not evolved to adequately represent these more nuanced and critical aspects of modern mobile broadband. They continue to primarily reflect the strength of the radio signal received by the device, rather than the available bandwidth, the level of interference, or the network’s overall capacity to handle data traffic. This discrepancy creates a "false reality of coverage," where a full display of bars can exist concurrently with severely degraded internet performance, leading to user frustration and a misplaced sense of blame, often directed at either the device or the service provider.
Unpacking the Technical Realities: Beyond Raw Signal Strength
To comprehend why full signal bars do not guarantee high-speed internet, it is essential to delve into the more sophisticated metrics used by telecommunications engineers to assess network performance. These metrics go far beyond the rudimentary RSSI that loosely informs the bar display.
Reference Signal Received Power (RSRP): This is a more precise and standardized measurement of signal strength in 4G LTE and 5G networks. RSRP specifically measures the average power of the reference signals received by the mobile device from a cell tower. Measured in decibel-milliwatts (dBm), RSRP provides a granular indication of how strong the useful signal is. For instance, an RSRP value closer to -50 dBm indicates an excellent signal, while values around -110 dBm or lower signify a very weak or unusable signal. While RSRP is a better indicator of signal strength than RSSI, it still only tells part of the story. A strong RSRP (e.g., -70 dBm) can still result in slow speeds if other factors are poor.
Reference Signal Received Quality (RSRQ): This metric is arguably more critical for data performance than RSRP alone. RSRQ measures the quality of the received signal, taking into account both the strength of the desired signal and the level of interference from other cell towers or noise sources. It is calculated as RSRP divided by RSSI (or similar variations) and also expressed in dB. A good RSRQ value (e.g., -3 dB) indicates a clean signal with minimal interference, while a poor RSRQ (e.g., -20 dB) suggests a heavily polluted signal environment. This is where the analogy of a loud concert becomes particularly apt: you might hear the music at maximum volume (high RSRP), but if there’s excessive background noise or distortion (poor RSRQ), you won’t discern the individual notes or lyrics clearly, just as your phone might receive a strong signal but struggle to decode usable data.
Signal to Interference + Noise Ratio (SINR / SNR): Perhaps the most direct indicator of data throughput potential, SINR measures the ratio of the desired signal power to the power of interference plus noise. Expressed in decibels (dB), a higher SINR value translates directly to better data speeds. For instance, an SINR of 20 dB or higher is excellent for 5G, allowing for high modulation schemes and maximum data rates, whereas an SINR below 0 dB indicates that interference and noise are stronger than the actual signal, making reliable data transmission extremely difficult, regardless of how "strong" the raw signal might appear.

These technical parameters, often hidden from the user interface, are the true determinants of network performance. Modern smartphones and base stations constantly evaluate these metrics to adapt data transmission rates and modulation schemes. When RSRQ or SINR are low, even with high RSRP, the network must use more robust, but slower, encoding methods to ensure data integrity, thereby reducing the effective speed.
The Invisible Bottlenecks: Network Congestion and Infrastructure Limitations
Beyond signal quality, several other critical factors can severely impact mobile internet speeds, even when the device reports a full signal. These issues are often invisible to the user but are paramount to network operators.
Network Congestion: This is arguably the most frequent and impactful cause of slow speeds despite full signal bars. Every cell tower (base station) has a finite capacity for both bandwidth and the number of concurrent users it can serve efficiently. In densely populated urban areas, at peak usage times (e.g., lunch breaks, evening commutes), or during large events (concerts, sporting events), hundreds or even thousands of devices might be attempting to connect to a single cell tower simultaneously. Even if each device receives a strong signal from that tower, the available bandwidth must be shared among all active users. As more users connect and demand data, the individual speed for each user inevitably decreases. It’s akin to a multi-lane highway: even if the lanes are perfectly smooth (strong signal), traffic slows to a crawl if too many cars are trying to use it at once (congestion). This phenomenon is particularly pronounced in 5G non-standalone (NSA) deployments, which often rely on the existing 4G core network, potentially introducing bottlenecks if the 4G infrastructure is already strained.
Backhaul Capacity: The backhaul is the critical link that connects the cell tower to the operator’s core network and, ultimately, to the internet backbone. A robust signal between your phone and the tower is useless if the tower itself is connected to the core network via an inadequate or congested backhaul link. While modern 5G towers are increasingly connected via high-capacity fiber optic cables, some older or remote sites might still rely on less capable microwave links, which can become bottlenecks, especially during peak demand. Operators invest heavily in upgrading backhaul to support 5G’s immense bandwidth potential, but this is an ongoing process that varies significantly by region and provider.
Core Network Performance: The core network is the central nervous system of the mobile network, managing authentication, routing, and overall data flow. Issues within the core network, such as software glitches, hardware failures, or even planned maintenance, can lead to widespread performance degradation, irrespective of the signal strength at the user’s device. The transition to 5G standalone (SA) architectures, which feature a cloud-native, software-defined core, promises greater efficiency and lower latency, but also introduces new complexities in management and optimization.
Spectrum Allocation and Bandwidth: The amount and type of radio spectrum an operator possesses significantly influence its network’s capacity and speed. Operators with larger contiguous blocks of spectrum, especially in mid-band (C-band) and high-band (mmWave) frequencies, can offer higher peak speeds and greater capacity. However, lower frequency bands (sub-6 GHz) provide broader coverage but often less capacity. Even with full signal, if the operator’s spectrum in a particular area is limited or heavily utilized, speeds will be capped. Technologies like Carrier Aggregation (CA), which combines multiple frequency bands to increase bandwidth, help mitigate this, but its effectiveness depends on available spectrum and network configuration.
Antenna Performance and Configuration: The cell tower’s antennas and their configuration play a crucial role. Modern 5G networks utilize advanced antenna technologies like Massive MIMO (Multiple Input, Multiple Output) and beamforming. Massive MIMO employs a large array of antennas to transmit and receive data simultaneously, significantly boosting capacity and spectral efficiency. Beamforming directs focused radio beams towards individual users, improving signal quality and reducing interference. However, if these advanced features are not optimally configured, or if the antennas are experiencing technical issues, the network’s performance can suffer.
The Evolution of Mobile Connectivity: A Chronology of Increasing Demands
Understanding the historical progression of mobile technology helps contextualize the current challenges:
- 1G (1980s): Analog voice communication. Signal strength was paramount for basic calls.
- 2G (1990s): Digital voice and SMS (GSM, GPRS, EDGE). Signal bars became standard. Data speeds were extremely low (tens of kbps).
- 3G (Early 2000s): Introduction of mobile broadband (UMTS, HSPA). Speeds increased to a few Mbps, enabling basic web browsing and email. The inadequacy of signal bars for data quality began to emerge.
- 4G (Late 2000s – Early 2010s): True mobile broadband (LTE). Speeds reached tens to hundreds of Mbps, enabling streaming video and more complex applications. Data became the dominant use case. The gap between perceived signal (bars) and actual speed became more apparent, as network congestion and backhaul limitations started to significantly impact performance despite strong signal.
- 5G (Late 2010s – Present): Designed for ultra-high speeds (Gbps), ultra-low latency, and massive device connectivity. 5G promises enhanced Mobile Broadband (eMBB), Ultra-Reliable Low-Latency Communications (URLLC), and Massive Machine-Type Communications (mMTC). These ambitious goals place unprecedented demands on network infrastructure, making signal quality, capacity, and backhaul even more critical than ever before. The simplistic signal bar indicator is now arguably at its most misleading, as 5G performance is highly sensitive to factors like SINR, spectrum availability, and network load.
Expert Perspectives and Industry Responses
Telecommunications experts and industry analysts consistently highlight the need for greater transparency and user education regarding network performance. "The signal bars are a relic," states Dr. Elena Rodriguez, a prominent telecom engineer. "They served their purpose for voice calls, but for modern data-intensive applications, they provide a dangerously incomplete picture. Users need to understand that network capacity, interference, and backhaul are just as, if not more, important than raw signal strength."
Major mobile network operators are aware of this perception gap. While they cannot easily redesign smartphone UI indicators, they invest heavily in network optimization, deploying more cell sites, upgrading backhaul, and utilizing advanced technologies like Massive MIMO and beamforming to improve overall capacity and quality. They also provide online coverage maps that often differentiate between general signal presence and actual 5G availability, and some even offer tools to check network status in specific areas. However, these tools rarely provide granular detail on real-time congestion or specific technical metrics like RSRQ or SINR.
Regulatory bodies globally are also pushing for improved network performance reporting, encouraging operators to provide more detailed information about speeds and quality, especially for 5G deployments. This aims to empower consumers with better information when choosing a provider and to hold operators accountable for their service claims.
Implications and How Users Can Assess Real Performance
The implications of this disparity between perceived signal and actual performance are significant. For individual users, it leads to frustration and inefficient use of mobile data. For businesses relying on mobile connectivity, it can impact productivity and service delivery. For network operators, it poses a challenge in managing customer expectations and accurately communicating service capabilities.
So, how can users move beyond the deceptive simplicity of signal bars and gain a more accurate understanding of their mobile internet performance?
- Conduct Speed Tests: Regularly running speed tests using reputable services like Ookla Speedtest, Google Speed Test, or Fast.com provides a direct measurement of download and upload speeds, as well as latency. This is the most straightforward way to assess actual data throughput.
- Monitor Technical Metrics (Advanced Users): For Android users, apps like NetMonster or CellMapper can display real-time RSRP, RSRQ, and SINR values. While these apps are not available on iOS without jailbreaking, understanding these metrics can provide valuable insight into the quality of the connection.
- Check Operator Coverage Maps: While often optimistic, these maps can indicate whether 5G is theoretically available in your location and sometimes differentiate between different types of 5G (e.g., sub-6 GHz vs. mmWave).
- Observe Performance at Different Times/Locations: If speeds are consistently slow despite full bars, try checking at different times of day or in slightly different locations. This can help determine if the issue is congestion-related or specific to a particular cell tower.
- Report Issues to Your Operator: If you consistently experience poor performance, reporting the issue to your mobile operator with specific details (location, time, observed speeds) can help them diagnose and address potential network problems.
In conclusion, the era of 5G demands a more sophisticated understanding of mobile connectivity than what simple signal bars can convey. While these indicators provide basic assurance for voice and SMS, they are increasingly inadequate for representing the complex factors that determine high-speed data performance. As mobile networks continue to evolve, users and industry stakeholders alike must look beyond the intuitive, yet misleading, visual cues and embrace a more nuanced appreciation of the technical realities that truly drive our digital experiences. The future of mobile connectivity lies not just in strong signals, but in the intelligent management of capacity, quality, and an unyielding commitment to reducing invisible bottlenecks.
